Quick start
This page takes you from an installed TENSA to a power flow and a fault study on the IEEE 14-bus system, first in the browser and then from a script. Install comes first if you have not done it.
1. Start the server
tensa serve --workspace ~/tensa-cases --port 8000 --open
The server logs the address it serves and the workspace it uses, and --open opens your default browser there:
2026-10-06 09:30:12,345 [INFO] tensa.serve: serving http://127.0.0.1:8000/ (workspace: /home/you/tensa-cases)
The workspace is the directory the server reads case files from. If it is empty, the server fills it with three example cases the first time it starts: IEEE 14 (ieee14_full.xlsx), Kundur (kundur_full.xlsx) and WSCC 9-bus (wscc9.xlsx). Leave the server running. Ctrl+C in its terminal stops it, as does a kill of its process: it ends the sessions and their workers first, and is gone within a few seconds even with a page still open.
If you leave out --open, open the address in a browser yourself. Use http://127.0.0.1:8000 or http://localhost:8000, the two spellings the server accepts by default.
To have the app in a window of its own instead of a browser tab, run tensa desktop, which Install describes. The rest of this page is the same there.
2. Load a case
In the left rail, under Saved cases, click ieee14_full.xlsx. The one-line diagram appears, the Buses table at the bottom lists the 14 buses, and the left rail shows the case with its state, pre-setup, which means nothing has run yet.
The first case you load after installing can take about half a minute while ANDES generates its code. Later loads are quick.
A card near the case list walks you through these first steps. It appears once per browser profile and the x closes it.
3. Run a power flow
Click Run PF in the top bar. A toast says PF converged in 3 iterations, and the page fills with the result:
- The diagram shows each bus voltage in per unit and the flow on every line and transformer. Buses and lines turn amber and red as they near and pass their limits.
- The Buses, Lines, Generators, Loads and Shunts tabs of the bottom drawer hold the numbers.
- The Violations tab counts the limits the solution breaks, and lists them.
The run has set the case up for simulation, so the left rail now says committed and the case is locked against structural edits until you reset it. Concepts explains why.
4. Add a fault and run a time-domain simulation
- In the top bar, switch the PF | TDS toggle to TDS. The run button now reads Run TDS.
- In the left rail, under Disturbances, click Add fault. Leave Kind on
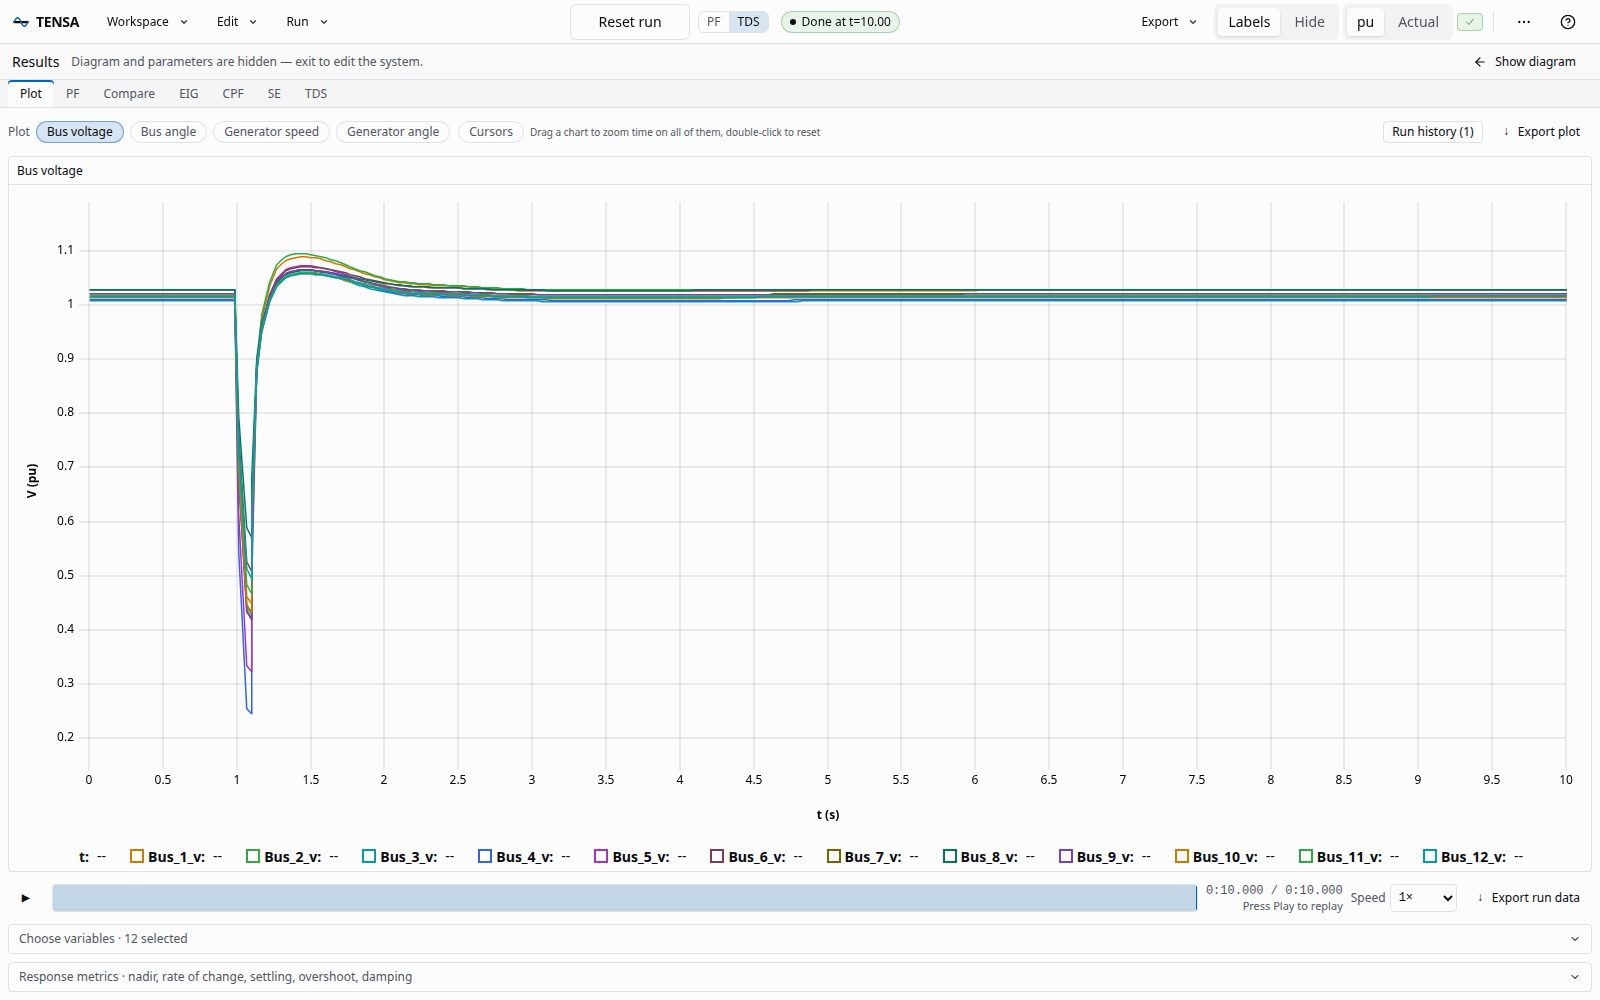
Fault, pick4 - BUS4as the bus, and click Add. The defaults apply a three-phase fault at 1 s and clear it at 1.1 s. The list saysApplied the next time you run TDS, so it makes no difference that the power flow has already run. - Click Run TDS. The default run lasts 10 s. The results stream in as the run goes, and the badge beside the toggle ends at
Done at t=10.00. When the run is over, the button reads Reset run: it reloads the case so that you can change it and run again.
The bottom drawer switches to Analysis, with the Plot tab open: the bus voltages dip when the fault is applied and recover when it clears. The buttons above the plot switch it to bus angle, generator speed or generator angle. Expand plot (or Ctrl+Shift+M, Cmd+Shift+M on a Mac) gives the plot the whole window.
5. Keep what you did
The Export menu in the top bar saves a self-contained HTML report of the runs, a reproducibility bundle, or a snapshot. Workspace has Save system as to write the case back to a file. The UI tour covers each of them.
The same from a script
Everything the UI does goes through the HTTP API. With the server from step 1 running, this is the same study with curl:
BASE=http://127.0.0.1:8000/api

SESSION=$(curl -s -X POST $BASE/sessions | python3 -c "import json,sys; print(json.load(sys.stdin)['session_id'])")

curl -s -X POST $BASE/sessions/$SESSION/case \
  -H 'Content-Type: application/json' \
  -d '{"primary_path": "ieee14_full.xlsx"}'

curl -s -X POST $BASE/sessions/$SESSION/disturbances \
  -H 'Content-Type: application/json' \
  -d '{"disturbances": [{"kind": "fault", "bus_idx": "4", "tf": 1.0, "tc": 1.1, "xf": 0.05, "rf": 0}]}'

curl -s -X POST $BASE/sessions/$SESSION/pflow \
  -H 'Content-Type: application/json' -d '{}'

curl -s -X POST $BASE/sessions/$SESSION/tds \
  -H 'Content-Type: application/json' -d '{"tf": 5.0}'

curl -s -X DELETE $BASE/sessions/$SESSION
These commands are for a POSIX shell. On Windows, use the Python client below, or Invoke-RestMethod in PowerShell.
A session is one ANDES system in its own process. You create it, load a case into it, add disturbances while the case is still in its pre-setup state, run a power flow and then a simulation, and close the session when you are done. A request with a JSON body needs the Content-Type: application/json header, or the server answers 422.
The repository has a Python client that uses only the standard library, examples/tensa_client.py. Copy that one file next to your script:
from tensa_client import AndesApp

app = AndesApp("http://127.0.0.1:8000")
with app.session() as s:
    s.load_case("ieee14_full.xlsx")
    s.add_fault(bus_idx="4", tf=1.0, tc=1.1)
    print(s.run_pflow()["converged"])
    print(s.run_tds(tf=5.0)["converged"])
The API guide explains the routes, the errors and the streaming protocol, and the route reference lists every one of them.
Where next
- UI tour: what each part of the window does.
- Concepts: sessions, the workspace, and the rule about when a case can be changed.
- Troubleshooting, if a step above did not go as described.