UI tour
This page walks through the window, region by region, and then through the analyses. It describes what is there and where to find it. The quick start is the page to follow if you want to do something first.
The window
The picture shows IEEE 14 after a power flow. Five areas make up the window, numbered in the picture.
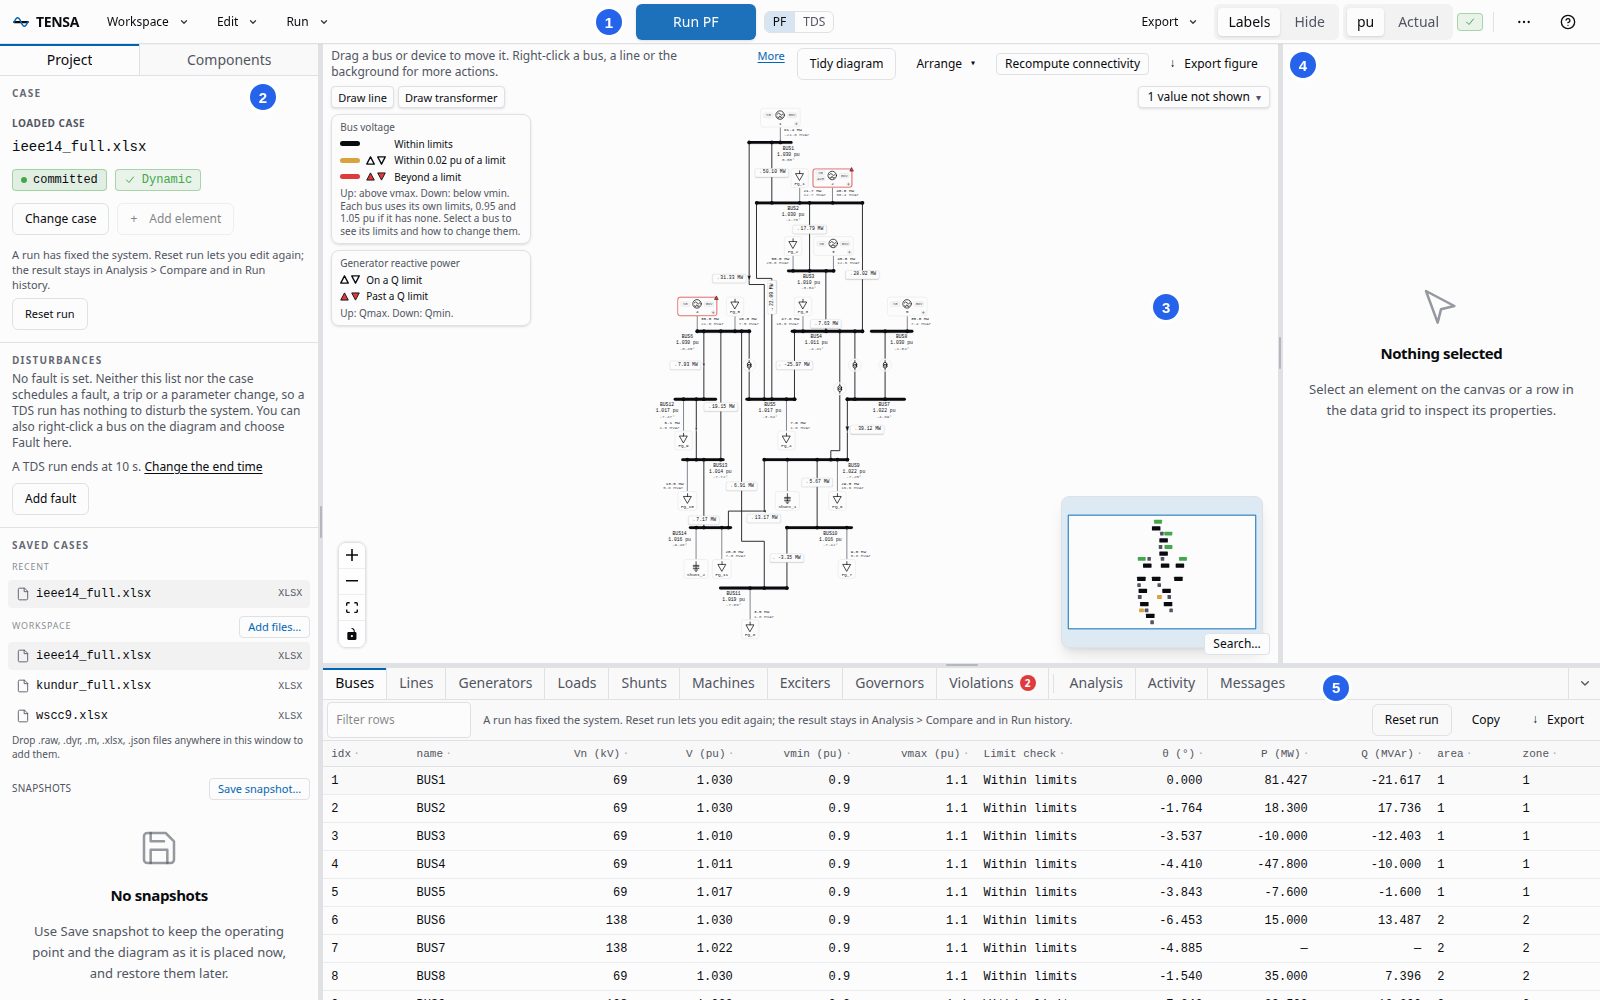
- Top bar. The menus, the run button and the display toggles.
- Left rail. Two tabs: Project, with the case, its disturbances, the saved cases and the snapshots, and Components, with the palette of what a system is built from.
- Diagram. The one-line diagram of the loaded case.
- Inspector. The properties of whatever element you select.
- Bottom drawer. The tables of the case, the analyses and their plots, the activity list and the ANDES messages.
The panels can be hidden to give the diagram room: Ctrl+B toggles the left rail, Ctrl+\ the inspector and Ctrl+J the bottom drawer (Cmd instead of Ctrl on a Mac). Dividers between the panels can be dragged to resize them. The bottom drawer dragged all the way down is its row of tabs and no more, and the button at the end of that row does the same and opens it again, as a click on a tab does. Open, it is never lower than a table needs for its bar, its heading and two rows, in a window of any height. Ctrl+Shift+L switches between the light and the dark theme.
Top bar
Workspace holds what concerns the files and the saved state of the case: Open case, Save, Save system as (writes the system back to an .xlsx, .raw or .json file), Save snapshot and Load snapshot, Import bundle and Reports. Before a case has been run it also offers Add element, Add PMU and Import profile.
Edit has Undo and Redo for the edits made before a run, Reload from file, which discards them, and the switch to Edit mode for changing controller parameters.
Run starts a routine. Each entry that says Run runs: Run power flow (PF), Run time-domain simulation (TDS), Run eigenvalue analysis (EIG), Run continuation power flow (CPF) and Run state estimation (SE) start the routine as its own Run button does, and open its tab of the bottom drawer where that is where it is run. One that cannot run yet says why in a notice. The eigenvalue analysis is greyed out, with what to do first under its name, until a power flow of a case with dynamic models has converged; the command palette lists it the same way. Parameter sweep... and CPF QV curve of a bus... need something picked first, and open the place where that is done. The routine chosen last is ticked, and Run again (Ctrl+Enter) starts it once more. The menu also opens the run history.
The big blue button is Run PF or Run TDS, according to the PF | TDS toggle beside it. While a time-domain run goes, it turns into Abort, and Esc does the same. After a run, it reads Reset run, which reloads the case so that you can change it and run again.
Export saves a bundle, a snapshot or an HTML report, and opens the figure of the diagram (see A figure for a paper). Plots have an export menu of their own: CSV and PNG, COMTRADE for a time-domain run, and a MATLAB .mat file of the state matrix and eigenvalues for the eigenvalue plot.
The other controls on the right of the bar:
- Labels | Hide shows or hides the numbers on the diagram.
- pu | Actual switches bus voltage between per unit and kV, and generator speed between per unit and Hz. Angles are in degrees and powers in MW and MVAr either way. It changes what you read, not what you type: a set-point such as
p0orq0is edited in per unit of the system base in both, and the Inspector shows what it comes to in MW or MVAr under it. In the Loads and Generators tables the columns you edit are headed set-point and the ones a power flow fills in solved. - The check mark chip says whether the loaded case has the dynamic models a time-domain run needs.
- The search button (
Ctrl+K) opens the command palette, which finds every command by name. When it closes, the keyboard focus goes back to where it was, or to the tab a command opened. - History lists the runs kept in this browser, so you can rename them, pin two to compare, or delete them.
- The theme switch changes between the light and dark theme.
- The ? menu has the keyboard shortcuts, Moving a line by hand and Connecting on the diagram, which open the list of what the diagram answers to at that part, a link to the API reference the server serves at
/docs, and the TENSA and ANDES versions of the server.
Below about 1800 px of window width, the search button, the theme switch and History move into a ... menu, and on narrower windows so do the panel toggles and the Labels and pu | Actual switches. Each of them is still a command with a keyboard shortcut.
Left rail
The left rail has two tabs, Project and Components, and opens on the one you used last.
Project is the work in hand:
- Case shows the loaded case and its state:
pre-setupbefore a run,committedafter one. A second badge says whether the case has dynamic models (Dynamic) or not (Static-only). Change case loads another, and Add element opens the element builder. - Disturbances lists what the next time-domain run will do to the system: the faults, trips and parameter changes you added, plus any the case file itself holds. Add fault (or Add disturbance) opens a form for a fault on a bus, a line or device trip (a toggle), or a scheduled parameter change (an alter).
- Saved cases lists the case files of the workspace, and the ones you opened recently. Add files copies files into the workspace, and so does dropping them anywhere on the window:
.raw,.dyr,.m,.xlsxand.jsonfiles. A.rawdropped together with its.dyropens as the pair. - Snapshots lists the snapshots you saved for this case, under a Save snapshot button that saves one. A snapshot records the case, its disturbances and the diagram as it was placed. Click a snapshot to restore it: that reloads the case, adds the disturbances again, solves the power flow and puts the diagram back.
A reload of the page starts a new session, and the page opens the case again by itself: the file, with the dynamic files it was opened with, or a new blank system for one you were building from scratch. The elements you added, changed or deleted since you opened it are put back onto it, and a notice says how many changes that was. The drafts on the diagram and its layout come back with the case; a system built from scratch has no layout file, so it is arranged afresh, with its drafts where they stood. What a reload does not bring back is the state of a run: the case is as before the run, and the results are in the run history. A case you closed yourself with Change case is not opened again, and a file that is no longer in the workspace leaves the page as on a first visit, with a notice that names the case. Reloading again before the case is back does no harm: the page that comes up opens it with the same edits. If the server does not answer, the notice says so, and the next reload tries again.
Components is the palette a system is built from. It lists every kind of element the element builder can add, grouped as the builder's Kind list is (network, transformers, generators, exciters, governors, storage, loads and shunts), each with a line that says what it is and what it needs first: a GENROU machine needs a PV or Slack generator on its bus, an exciter regulates a machine. Type in Search components to narrow the list by name, model or category (exciter, GENROU, storage, avr). Click a row to open the element form on that kind, or drag it onto the diagram to add it there as a draft (see Drafts), on the bar or the name of a bus to connect it to that bus (see Connecting by a drag); with no case open, either starts a blank system, and a line above the search box leads to the Project tab, where the saved cases are. From the keyboard, Tab stops at the list once, the arrow keys move between the rows and Enter opens the form. While nothing can be added, because a run has fixed the system, the rows are greyed out and a note above them says so, with a Reset run button in it.
Diagram
The diagram is a traditional busbar one-line, and nothing on it is drawn over anything else: no line lies on another or runs through a bar, a symbol or a label, and no label stands on a symbol, a line or another label. A case with no saved layout opens arranged that way, with its buses on a grid, each generator, load and shunt over or under its bar, and every line routed. Drag a bus, a generator, a load or a shunt to move it: where you leave it is saved in a layout file beside the case, so it is there when you open the case again. The file holds the whole diagram as it is drawn, the lines included, and every way of saving the system takes it along, so a case saved under a new name, a restored snapshot and an imported bundle all open with the picture they were saved with. Right-click a bus, a line or the background for more actions, such as putting a fault on a bus or, on the background, tidying the diagram or saving a snapshot.
A generator, a load or a shunt is joined to its bus by a connector that leaves from the middle of the face that points at the bus and lands on the bar, at a dot. Under or over the bar the connector drops square onto it. Past the tip of the bar it runs to the tip, as a diagonal. If you prefer right angles, right-click the background and pick Right angle under Device connectors (Straight puts the diagonals back); the choice is saved with the layout. Either way a connector goes round the other symbols and not through them. Lines and transformers land on the bars too, each at a dot of its own: no two connections share one, whichever side of the bar they come to, and a bar is as long as its connections need.
A generator is drawn once, with everything that belongs to it. The static generator the power flow solves (PV, Slack), the machine that takes its place in a time-domain run (GENROU, GENCLS) and their controllers are one symbol, under the name of the static generator. Small chips on either side of the machine symbol name the dynamic models: SG is the machine, AVR the exciter, GOV the governor and PSS the stabiliser, and a converter and its controls go by their stage (REGC, REEC, REPC). Click the symbol to inspect the generator, and a chip to inspect that model. The small plus at the end of the name draws the control chain out beside the symbol, one row per model with each under the one it refers to, and the minus folds it away again; Show control chain in the right-click menu of the generator does the same. A chain that is drawn out is saved with the layout. It stands on the side away from the bus, or beside the symbol when a bar, another symbol or a line is in the way there, and it is drawn over whatever is behind it, so move the generator if it covers something you need. Drag a generator by its machine symbol or its name: the chips are for clicking. A controller that acts on a bus and not on a generator, such as a PMU, keeps a badge of its own beside the bus.
To place something without dragging, click it and press the arrow keys, with Shift for bigger steps. The right-click menu of a bus, a generator, a load or a shunt has Move with arrow keys, which selects it for the keys. A bus that is moved takes its generators, loads and shunts with it. What you drop on something does not stay there: a bus or device let go on another symbol, on a bar or on the connector of a device, or a bus let go with its bar right under another, is put in the nearest free place, and a notice says so and what it was dropped on. Undo puts it back where it was before the move. A place also has to be one the diagram can be drawn with: where the connector of a device would have to run through a symbol or a bar to reach its bus (a load let go far from its bus, beyond the devices of another), the device is put a little way off, and if no place near is clear it goes back where it stood and the notice says Put back where it was. A device can stand behind another device of its bus, further from the bar: its connector then steps round the one in front and comes down onto the bar beside it. The padlock button at the bottom left locks the diagram: while it is on, nothing can be dragged, selected or arranged, and the bar above the diagram says so. That bar is one line of what to do next, for what is selected, with a More button that opens the whole of it where it does not fit.
The lines follow what you move. A bus that is dragged has its lines routed to where it is, round whatever stands in between, and a generator or load dropped on a line has the line routed round it; the routes are kept with the move, so one Undo takes back both. Tidy diagram, above the diagram, routes the lines and transformers again, all together, and moves nothing. A line keeps the route it has unless the tidy finds it a better one: no longer, with no more bends and crossed in no more places, and less of one of the three. So a tidy after one device was moved changes the lines that gain by it and leaves the rest where they ran: a line that went round a device you have since moved away gets its direct way back, and the lines beside it stay as they are. A line that is drawn through a symbol, through a bar or along another line is routed clear before anything else, and where there is no way round the lines that stay, those are routed again with it. The lines run at right angles along the grid of the background dots, each from a tap of its own. They keep clear of the buses they pass, of the generators, loads and shunts and of the labels of the buses, no two of them share a run or run closer than 12 units side by side, and they cross as seldom as the router finds a way to. Use it after you have moved things about: lines routed one move at a time take more turns than lines routed together. On a diagram that is tidy already it says so and changes nothing. A tidy leaves nothing drawn over anything else that was clear before it, and no label of a bus without the place it had: lines that would have come down where a label stands are routed another way. In the rare case that it cannot (mostly a device that stands far from its bus, whose connector would run through a symbol once the lines are routed afresh), it changes nothing and says so; Tidy and re-layout puts every device back beside its bus. What the last tidy came to stays beside the button (Already tidy: nothing was changed, Not tidied: nothing was changed, or how many lines were re-routed and how many were left as they were) until you arrange the diagram some other way. The button shows a number in the rare case that a line is drawn through a symbol or a bar because no way round was found as it was drawn, which is how many a tidy would put right. The routes are saved with the layout.
A small diagram is tidied at once. A large one, of a hundred buses or more, takes about a second, and the router stops there: it is given a fixed amount of work, and routes the diagram as well as that allows. Meanwhile the button reads Tidying, the page keeps answering, and Stop beside it calls the work off with nothing changed. A line it found no way for keeps the route it had, and the notice says how many there are. A diagram that is spread over far more room than its buses need is not tidied at all, and the notice says so: bring the buses together first, or use Reset to auto-layout.
You can also move a line yourself. Click a line, a transformer or the connector of a generator, load or shunt: it turns blue, shows a square on each bend and a round plus beside each run, and the row above the diagram names it, says whether it is Routed automatically or Routed by hand, and has the buttons that go with it. Drag a run to slide it sideways. The runs it meets stay level or upright, and where a run ends on a device a square step is put in, so the line stays attached at both ends. Drag a square to move a bend, and hold Alt or Shift while you drag to move the bend alone, which leaves the runs beside it at an angle. Drag a plus to pull a new bend out of a run, or double-click a run (or press Add bend) to put a bend in where it is: the bend then moves alone when you drag it or press the arrow keys, which makes the line turn there, and either half of the run slides on its own, which makes a square step. Double-click a square, or pick it and press Remove bend or Delete, to take the bend out. The handles also work from the keyboard: Tab goes from one to the next, the arrow keys move the run or bend that has the focus (Shift for bigger steps), Enter adds a bend to a run, and Esc, Done or a click on the background lets go of the line. Move route by hand in the right-click menu of a line picks it as a click does and puts the focus on its longest run, so the arrow keys slide it straight away. A line is thin, and there are three ways to pick one without aiming at it: click its row in the Lines table, which also brings the line into view when it does not show whole; press Move route by hand in the Route on the diagram section of its Inspector; or Tab to the line on the diagram and press Enter or Space, which puts the focus on its longest run. The same section says whether the route is drawn automatically or by hand and has Reset route. The end of a line stays on the bar of its bus and can be slid anywhere along it, and the connector of a device keeps leaving from the middle of the face it left by.
The rule that nothing is drawn over anything else holds while you do this. If you drag a run or a bend to where the line would lie on another line or too close beside it, run through a bar, a symbol or a label, or leave a transformer no room for its symbol, the line is drawn at the nearest place where it is on nothing, the route you asked for is shown dashed in red, and the row above the diagram says what is in the way. That place keeps the room the automatic routing keeps: 8 px to a symbol, a control chain and a bar the line does not end on, and 4 px to a label and to the values of a device, so the line does not come to touch what you moved it off. A line you move ends on its own tap and reads as ending there: the run that ends on a bar comes to it at 30 degrees or steeper (only into the tap at the tip of a bar, from beyond the tip, may it come flatter), and it keeps 10 px from the middle of the dot of any other line's end, so it never runs along its bar or over the end beside its own. A bend keeps 12 px from every other line, the room two lines side by side keep, and the line keeps as far from the bends of the others: a corner drawn on another line, or right beside it, would read as the two lines meeting there. Drag a bend closer and it is drawn where it keeps that room, short of the line or past it where both its runs cross the line clear of the bend. A bend whose removal would leave the line running along its bar is not taken out, and the row above the diagram says why. What that row says about a move is shown whole: a reason too long for its one line goes on under it, over the top edge of the diagram. A line you move cannot fold back on itself or double back on the run before it by more than 135 degrees, the connector of a device leaves the face of its symbol at 30 degrees or steeper and cannot run back along its edge, and no move leaves a step shorter than 12 px: slide a run less than that where it would make one and the line stays as it is, with a note to keep dragging, and one press of an arrow key makes a step of 12 px. If no place near is clear the line stays where it was. Lines may cross.
A line you moved is yours from then on. Tidy diagram and Tidy and re-layout leave it as it is and route the other lines round it, and their notice says how many they left alone. It follows its ends: when you move one of its buses, or the device of a connector you drew, the end goes along and the rest keeps its shape. Where that would put it on something, fold it back on itself or run it along its own symbol, the line is routed automatically again and a notice names it; Undo takes the move back and the route with it. Tidy and re-layout treats your routes the same way: it lays the diagram out, takes along the ones that still fit where the buses and devices now stand, and names the ones it had to route again. Reset route, in the row above the diagram while the line is picked, in the right-click menu of the line and in its Inspector, gives it back to the automatic routing, and Reset manual routes in the Arrange menu does so for every line at once. Each of these, and each move of a run or a bend, is one step for Undo. The routes are saved with the layout, so they come back with the case, with a snapshot and with a bundle.
The values a power flow adds are placed around what is drawn. The P and Q of a generator or load stand beside its connector, on the side that is free, or on the far side of the device or beside its symbol when neither is, and a tidy leaves each device one of those places clear of lines where it can. The flow of a line, and the symbol of a transformer, sit on a straight run of the route, or just beside one where the run itself is taken, off the symbols and off each other; between lines that run close, the flow is turned to read along its line. A flow keeps a little way off every symbol, and off the triangle a generator at a reactive limit carries on its corner. The label of a bus moves along under its bar to stay clear of a line that passes there and of a device that stands there, and goes over the bar or beside a tip when there is no place left under it. It stays next to its bar: where the name with the voltage and the angle has no place there, the label shows the name alone, and the values are in its tooltip and in the Buses table. A name that has no place by its bar at all stands where nothing of another bus is between it and its bar. Where a diagram is too crowded for a value to stand clear of everything, that value is left off the diagram, and not drawn over something. The diagram says so: a count over its top right corner (12 values not shown) is there while any value is missing, and opens the list of them, each with what it reads, under Line flows, P and Q of generators and loads, and Bus voltages and angles. Pick one in the list to go to its element: the view moves to it, at a size it can be read at, and it is selected, a line with its handles showing, so that you can move it to make room. The tables and the Inspector have every value as well.
The Arrange menu beside it has the rest:
- Tidy and re-layout also moves things. It puts the buses on the grid, and in line with the ones they are nearly level or nearly in a column with, puts every generator, load and shunt back beside its bus, over or under the bar so that its connector drops square, and then tidies the lines. Use it on a diagram that has drifted, and Reset to auto-layout (right-click the background) to go back to the layout the case opened with. Fit view, in the same menu, brings the whole diagram into view, clear of the minimap and the zoom buttons.
- Snap to grid makes whatever you drag, or move with the arrow keys, land on the grid, the runs and bends of a line you move by hand included. It is a preference of yours, kept in the browser and not in the layout of a case.
- Reset manual routes gives every line, transformer and device connector whose route you drew back to the automatic routing. The menu says how many there are, and how a line is moved by hand in the first place.
- Align and Distribute act on the buses and devices that are picked together. Hold Shift and drag a box around them, or hold Ctrl and click each: the picked ones are outlined, a bar over the diagram says how many there are and has the same buttons, and dragging one of them moves them all. Align brings them onto one line (left, centre, right, top, middle or bottom, the bar of a bus counting and not its label), and Distribute, from three, evens out the gaps between them. A click on the background lets go of them.
Every one of these, and every move, can be taken back: Undo (Ctrl+Z) restores the diagram as it was before the last change, whether that was a drag, a tidy or an alignment, and Redo puts the change back. The Edit menu names what each would act on. They are the same Undo and Redo that take back an edit to the system, and they act on whichever you changed last, the system or the arrangement.
After a power flow the diagram carries the results. Each bus shows its voltage and angle, each line and transformer its flow, and each generator and load its power. Buses turn amber when they are within 0.02 pu of a limit and red beyond it, each against its own limits, and lines turn amber and red as they near and pass their rating. A small triangle marks the side of the limit, and a generator held at a reactive limit is marked too. The legends at the top left say which is which.
Zoom with the buttons at the bottom left or the mouse wheel. The minimap at the bottom right shows where you are, and Search (Ctrl+/) jumps to a bus or an element. Type part of its name, its idx or its ANDES model (genrou), or a word for what it is: bus, generator, load, shunt, machine, exciter, governor, pss, or controller for any controller. Every word typed has to be found, so governor 2 lists the governors with a 2 in their name or idx, and each row says what it is and of which model. Under the box there is a button for each kind the diagram has (Buses, Generators, Machines, Exciters, Governors and so on) with how many there are. Press one to list that kind with nothing typed, which is how you see the controllers of a case whose names you do not know; All lists everything again. A machine or a controller of a generator is found too, and shown where its generator is. When nothing is found because the diagram has none of that kind, the list says so and names the dynamic models it does have, and for a case with no dynamic models it says that the case is static-only. Lines and transformers are not in the list: click one on the diagram. Recompute connectivity counts the electrical islands of the system after a run.
A diagram opens fitted whole to its pane, so in a short window, or under a tall bottom drawer, it can be too small to read. The diagram keeps a least height whatever the drawer was left at. The first time a diagram opens too small to read in the strip a tall drawer leaves it, and the room of the drawer would make it readable, the drawer is lowered to its tabs and a notice says so; after that the drawer stays as you leave it. Where the diagram is still too small, the line above it says so and gives the zoom, and the button beside it, Zoom to 100%, brings the diagram to full size, on what is selected or on the middle of the diagram. The + button at the bottom left of the diagram, and the mouse wheel, zoom in a step at a time. With a bus or a device selected the button is named for it (Zoom to PQ_1) and goes there. Picking a bus or a device in a table of the bottom drawer, or in Search, also shows it at full size when the diagram is that small; otherwise the zoom stays as you set it. The connector of a selected generator, load or shunt is drawn heavier and in blue, and so is the connector of one you are dragging, so you can tell it from its neighbours and watch where it lands on the bar.
Drafts
Drag a row of the Components palette onto the diagram and it stands where you drop it, as a draft: a dashed, hatched box with the symbol of its kind, the idx it would get and a badge that reads Incomplete. A draft is on the diagram but not in the system. No run sees it, the tables do not list it, and nothing is sent to the server until you add it. Dropped on a symbol, a connector or a line, it stands in the nearest free place, and a notice says so; dropped on the bar or the name of a bus, it is connected to that bus (see Connecting by a drag). A generator, a load or a shunt that was dropped on no bus says so in its notice, whose Pick a bus button puts the cursor in the bus field of its form. A draft leaves the lines of the system as they run: where they run close together, the nearest free ground may be a bus or two away, and the view goes to the draft if that is out of sight.
The Inspector opens on the draft with the form of its kind. Every required field that is still empty is outlined and says so, a value that cannot be used says why, and the line above the buttons names what is missing. What you enter is kept as you type, so you can leave a draft and come back to it: click it again, or pick it from the Drafts button at the top right of the diagram, which counts the drafts, says how many are incomplete and lists them. When nothing is missing the badge reads Ready and Add to system adds the element; it then stands where the draft stood and is selected. The form fills in what the case already knows: the name follows the idx until you type one, and the rated voltage Vn is taken from the bus you pick, with a line that says so. A power in per unit shows what it is in MW or MVAr beside its field. While a run has fixed the system, the form says so and offers Reset run; the draft is kept meanwhile.
A draft is connected as you fill it in. Pick a bus for a generator, a load or a shunt and a dashed connector joins the draft to the bar. If you dropped it over, under or level with the bar of that bus, it stays where it is; if its connector would have been long or a diagonal, or would have crossed other lines, the draft goes beside the bus, where its connector drops square onto the bar, and a notice says so. Where the lines of the bus leave no room for that, it stands on free ground beside the bus with its connector at an angle, so that no line has to go round it. A line or a transformer is drawn as a dashed branch once both its buses are picked. Drag a draft to move it, as you would a device. Let go on a line, it stands beside the line where free ground is a little way off. Where there is none, the line goes round the draft for as long as it stands there, and runs as it ran before once the draft is moved, deleted or added: a draft changes nothing about the lines of the system, in the saved layout, in an Undo step or in a figure.
Connecting by a drag
Drop a component on a bus and it is connected to that bus. While you drag a row of the Components palette over the diagram, the bar of the bus it would land on is marked, over the bar itself and over the name of the bus; let go there and a generator, a load or a shunt is a draft on that bus at once, standing beside the bar with the bus already in its form. A line or a transformer dropped on a bus starts there, and a notice says to click the bus it goes to. A draft you have placed is connected the same way: drag it onto the bar of a bus. While such a draft is picked, the line above the diagram says so. A draft that is on a bus already goes to the bus you drag it onto, and a draft line takes the first bus it is dropped on as its start and the second as its end.
To draw a line or a transformer, press Draw line or Draw transformer at the top left of the diagram. The row above the diagram says what to do next, and every bus becomes a place to press: drag from the bus the line starts at to the bus it goes to, or click the two in turn. Esc, Cancel or a second press of the button stops. The line is placed as a draft, dashed, with both buses in its form; fill in its impedance and press Add to system. The right-click menu of a bus has Draw line from here and Draw transformer from here, the command palette has both commands, and a Line row dropped on a bus starts a line there. The buses to press are buttons with names (Start the line at bus 5, End the line at bus 9), so they can be reached with Tab and pressed with Enter.
To move a generator, a load or a shunt to another bus, select it. A ring shows where its connector meets the bar. Drag the ring onto the bar of another bus, or click the ring and then the bus; Move to another bus in the right-click menu of the device, or of its connector, asks for the bus the same way. The device then stands beside its new bus. For a draft this changes what the draft holds and nothing else. For an element of the system it is an edit, which Undo (Ctrl+Z, or Undo in the Edit menu) takes back. A generator that stands for a unit moves whole: its static generator and the machine on it are edited together, and Undo takes them back one at a time. A device that was rated for the bus it leaves is rated for the bus it goes to (its Vn follows): the notice says so, the Inspector marks the values that were changed since the case was opened with a dot, and the Finished list of the Activity tab names what the edit changed. From the keyboard, Tab to the ring, press Enter, Tab to the bus and press Enter. Once a run has fixed the system the ring is greyed out and says why, and the notice of a move that was not made has a Reset run button.
To delete a draft, use Delete draft in its form, the button beside it in the Drafts list, its right-click menu, or the Delete key while it has the focus. The notice that follows has an Undo, and once it is gone Undo in the Edit menu (Ctrl+Z) brings the draft back all the same. Drafts are kept in this browser, by case and by the workspace the server serves: after a reload of the page, and in a later visit, they are there again when the case is open, and the diagram is drawn as you left it. A case that opens with drafts from an earlier visit says so once, with Show, which lists them, and Delete all. The browser keeps the way each line took round a draft and the route of each draft line with the drafts, so the lines of the system come back on the paths they had. They are not part of the case file, of the layout saved beside it, or of a figure. The drafts of a system you build from scratch live as long as it is open, a reload of the page included, and Save system keeps them with the file it writes.
A figure for a paper
The Export figure button over the diagram has two entries. PNG of this view saves a picture of the pane as it is shown, colours, zoom and all. Figure for a paper opens the figure of the diagram: the publication look of the diagram, drawn for print, which you save as SVG, PDF or PNG. The Export menu of the top bar, a right-click on the background of the diagram and the command palette open the same dialog, under the same name.
The figure is the diagram as you arranged it. Every line runs along its route, every symbol stands where it stands on the diagram, and every label is where the diagram placed it, so arrange the diagram first and make the figure of it afterwards. What belongs to the screen is left out: the selection, the handles of a line that is being moved, the minimap. Nothing on the figure is drawn over anything else, as on the diagram. That goes for the arrow of a flow as well: where the place the diagram draws it at is on a crossing with another line or on a bend, the figure has it at the nearest place along its line that is clear.
On the right you choose how it looks and what it shows, and the preview on the left redraws at once. The preview opens fitted to the dialog. A tall figure is then small, and where its text is too small to read the line under the preview says at what fraction of its size it is shown: Show at 100% there, or 100% and 200% beside Fit, show it at its own size, with scroll bars.
- Style is black and white, or colour. In colour a bus or a line near or past a limit is amber or red, as on the diagram.
- Line width, Font (Helvetica, Times or Courier) and Text size. The text size is the largest a label is set in. A label is set smaller where the room the diagram keeps for it is less, and the dialog says which labels were held back and to what size: with the values of a power flow on the figure, the labels of the buses are 10 px at the most. Under the preview you can read how large the figure is in inches and its text in points, at full size. Scaled down to the width of a column the text shrinks with it, so a large diagram is easier to read as a figure of a part, or with fewer labels.
- Show has a box for each kind of label: the names of the buses, the names of the devices, the controllers of the generators, the voltages, the angles, the line flows, the P and Q of the generators and loads, and the marks of a limit. The last five come from a power flow, and can be chosen once one has run. Before that their boxes are empty and each says that it needs a power flow; what you chose for them earlier is kept, and is back once one has run.
- Part of the diagram is the whole diagram, or Selection only: the buses you picked together on the diagram (hold Shift and drag a box round them, or hold Ctrl and click each), with their generators, loads and shunts and the lines that run between two of them.
Download SVG, Download PDF and Download PNG save the figure that is shown. SVG and PDF are vector, sharp at any size. The PDF has its text as text, and pdfLaTeX places it with \includegraphics. It is set in fonts that every PDF reader has and embeds none, so a publisher that requires every font to be embedded will ask you to embed them when you build the final file. A PNG is made at the resolution you choose, 300 dpi unless you change it, and the dialog says how many pixels that is. What you choose is kept with the layout of the case, and comes back with it.
Inspector
Click an element on the diagram, or a row of a table, and the inspector shows its properties, the plots of its variables from the last run, and the disturbances that act on it. A draft that is picked shows the form it is filled in and added by instead (see Drafts). For a generator, a machine or one of their controllers, the properties end with the Generating unit it belongs to: every model of the unit, each under the one it refers to, and a click on a row goes to that model. The plots and the disturbances of a generator are those of the unit too: the speed and angle of its machine, and a trip of the machine, show under the generator. Before a run, a pencil beside a value changes it, and the bin in the header deletes the element. The mode button in the header, which reads Run or Edit, switches Edit mode on and off. In Edit mode the parameters of the case's controllers can be changed. Those changes are made on a copy of the case, so nothing touches the loaded system until you commit them with Save parameter edits as case.
Bottom drawer
The first tabs are tables of the case: Buses, Lines, Generators, Loads, Shunts, and the dynamic models Machines, Exciters and Governors. Before a run they hold the case's own values, and a double-click on a value changes it. Paste a block copied from a spreadsheet, filter the rows, or copy the table out. After a run the tables also show the results (voltage, angle, P and Q for buses, flows and loading for lines). A run fixes the values until you press Reset run in the table's bar. The note there says what the reset keeps (the results, in the Compare tab and the run history) and, when there are any, which unsaved edits it would lose.
- Violations lists every limit a power flow breaks (voltage, line loading, generator reactive power), with a count on the tab.
- Analysis holds the analyses, described below.
- Activity lists the jobs of this page load, in flight or finished, with a cancel button for a running one and a retry for a failed one.
- Messages lists what ANDES said while it loaded the case and ran: a device that failed to initialise, a power flow that stopped at its iteration limit, a fault applied at a given time. A count on the tab shows when there is something to read.
Analyses
The Analysis tab has a sub-tab for each routine. Ctrl+Shift+M (or Expand plot) opens the results view, which hides the diagram and gives the analysis the whole window. Show diagram brings it back.
PF sets the options of a power flow: the tolerance and iteration limit, a flat start, and whether generators are held at their reactive limits. A power flow that does not converge offers adjusted retries, and one that does gets a summary of generation, load, shunts, losses and the slack output.
Compare sets two power flows side by side: the change of every bus voltage and angle, of every line's flow, loss and loading, and of the system totals, with the largest change first. The last ten converged power flows are kept.
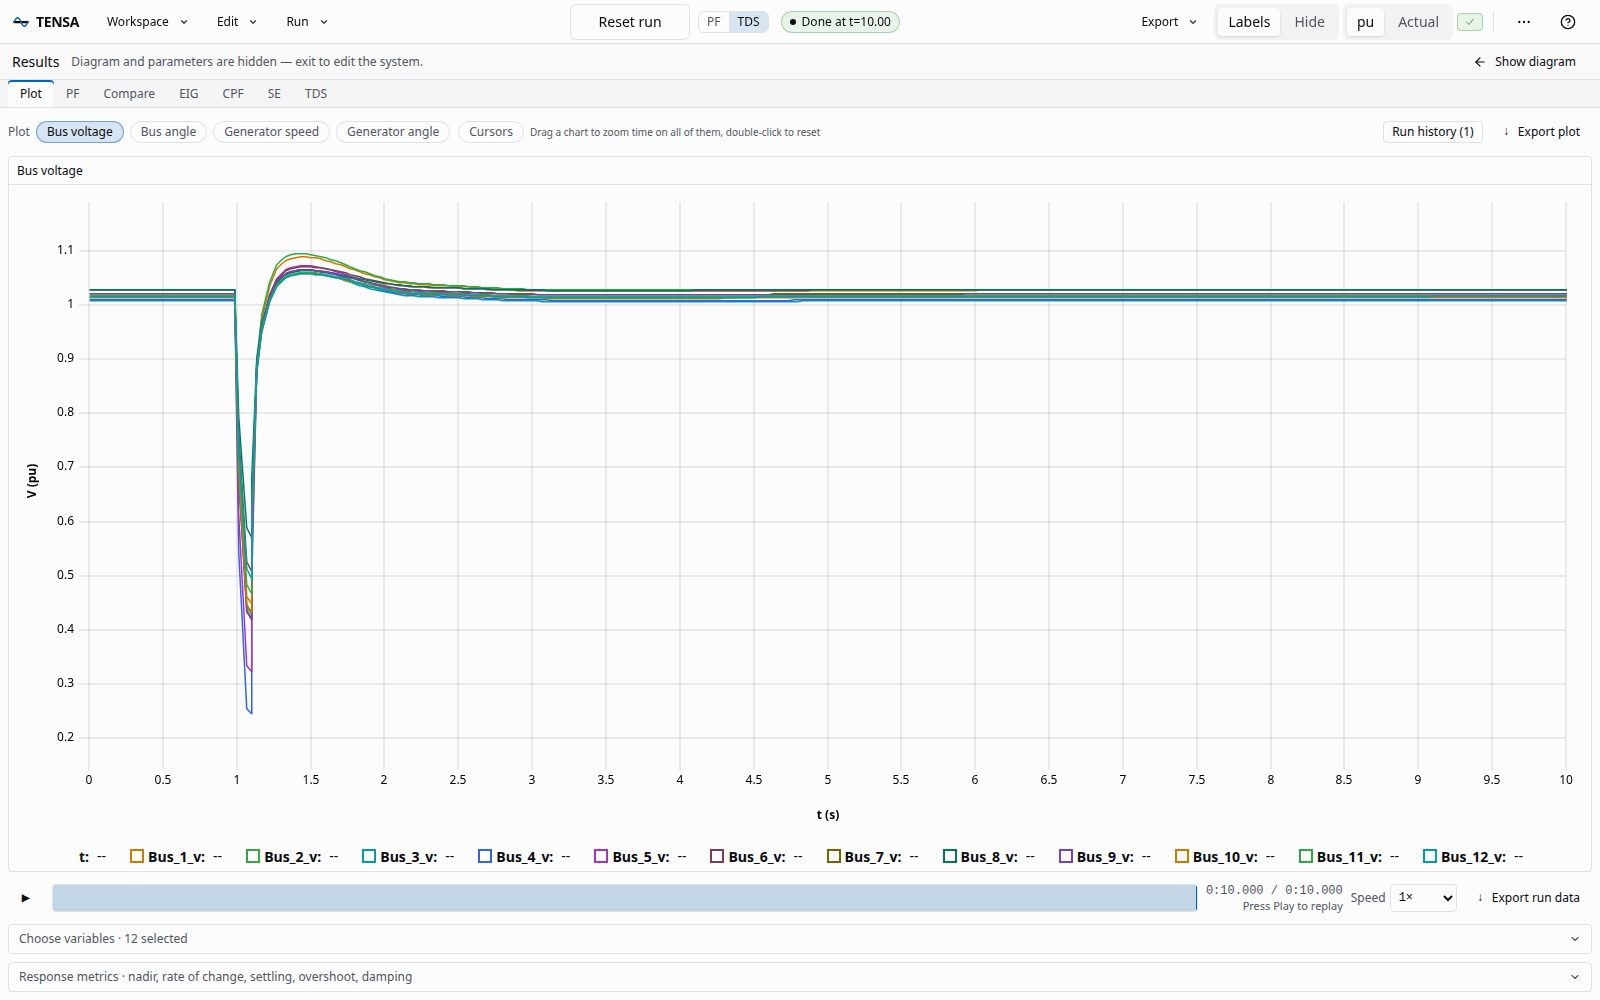
TDS sets the run: the end time (10 s by default), the step, the groups of variables to stream, the integrator (a fixed-step trapezoidal one, or the adaptive QNDF) and, optionally, any ANDES variable by name. Frequency control adds a droop or a fast frequency response on a battery or another distributed generator. The results stream into the Plot tab while the run goes: bus voltage, bus angle, generator speed and generator angle, with two cursors that read values and differences between two instants, a scrub bar to replay the run, and a table of response metrics (nadir, rate of change, settling time, overshoot, damping). The metrics describe the whole run, or the stretch between the two cursors; From the first disturbance puts the cursors on the earliest thing that disturbs the run (a fault, a trip or a parameter change you scheduled, or an event the case file holds) and on its end, and Whole run takes them off again. A signal that only rises reads no dip where its nadir would be the start value, and What the columns mean, under the table, defines each column.
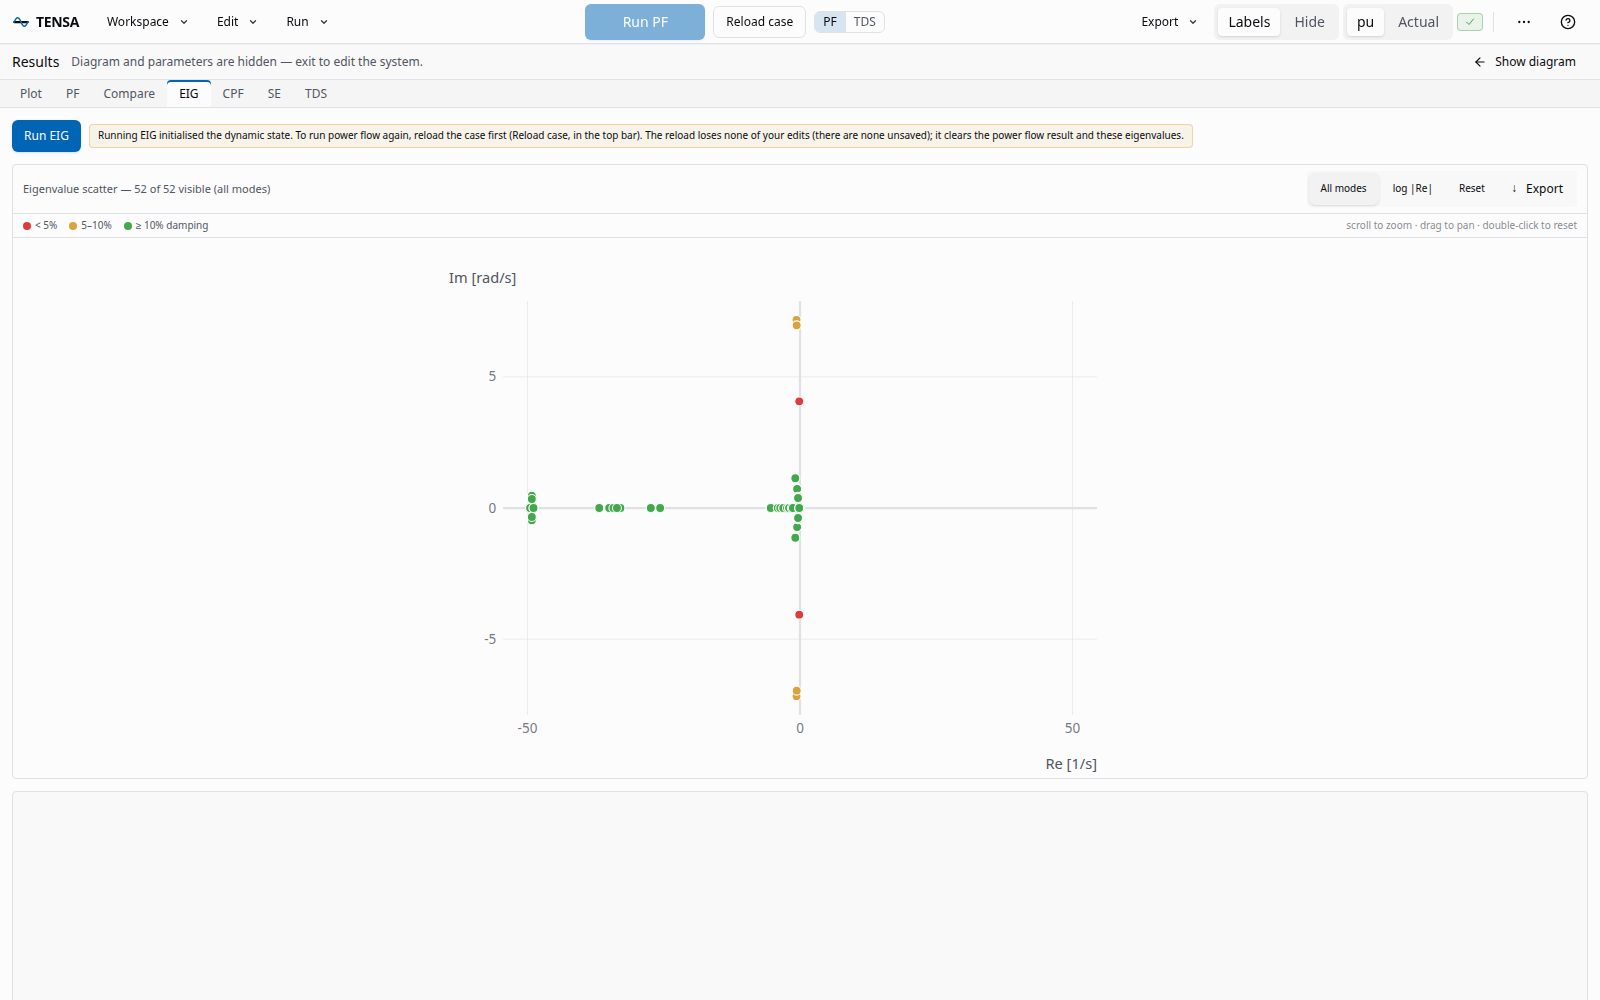
EIG runs the small-signal analysis and plots the eigenvalues. Click a point to see its participation factors. The plot opens on the poorly damped modes (a damping ratio under 0.05 with a real part under 5 in size), and All modes shows the rest; a system with no such mode opens on all of them, with a line that says so. A zero eigenvalue, which a system with no fixed angle reference has, is not one of them: it neither oscillates nor grows. After an eigenvalue run a power flow cannot run again until Reload case, which the entry of the Run menu and the Run EIG button say before the run; the notice after it says whether the reload would lose edits you have not saved.
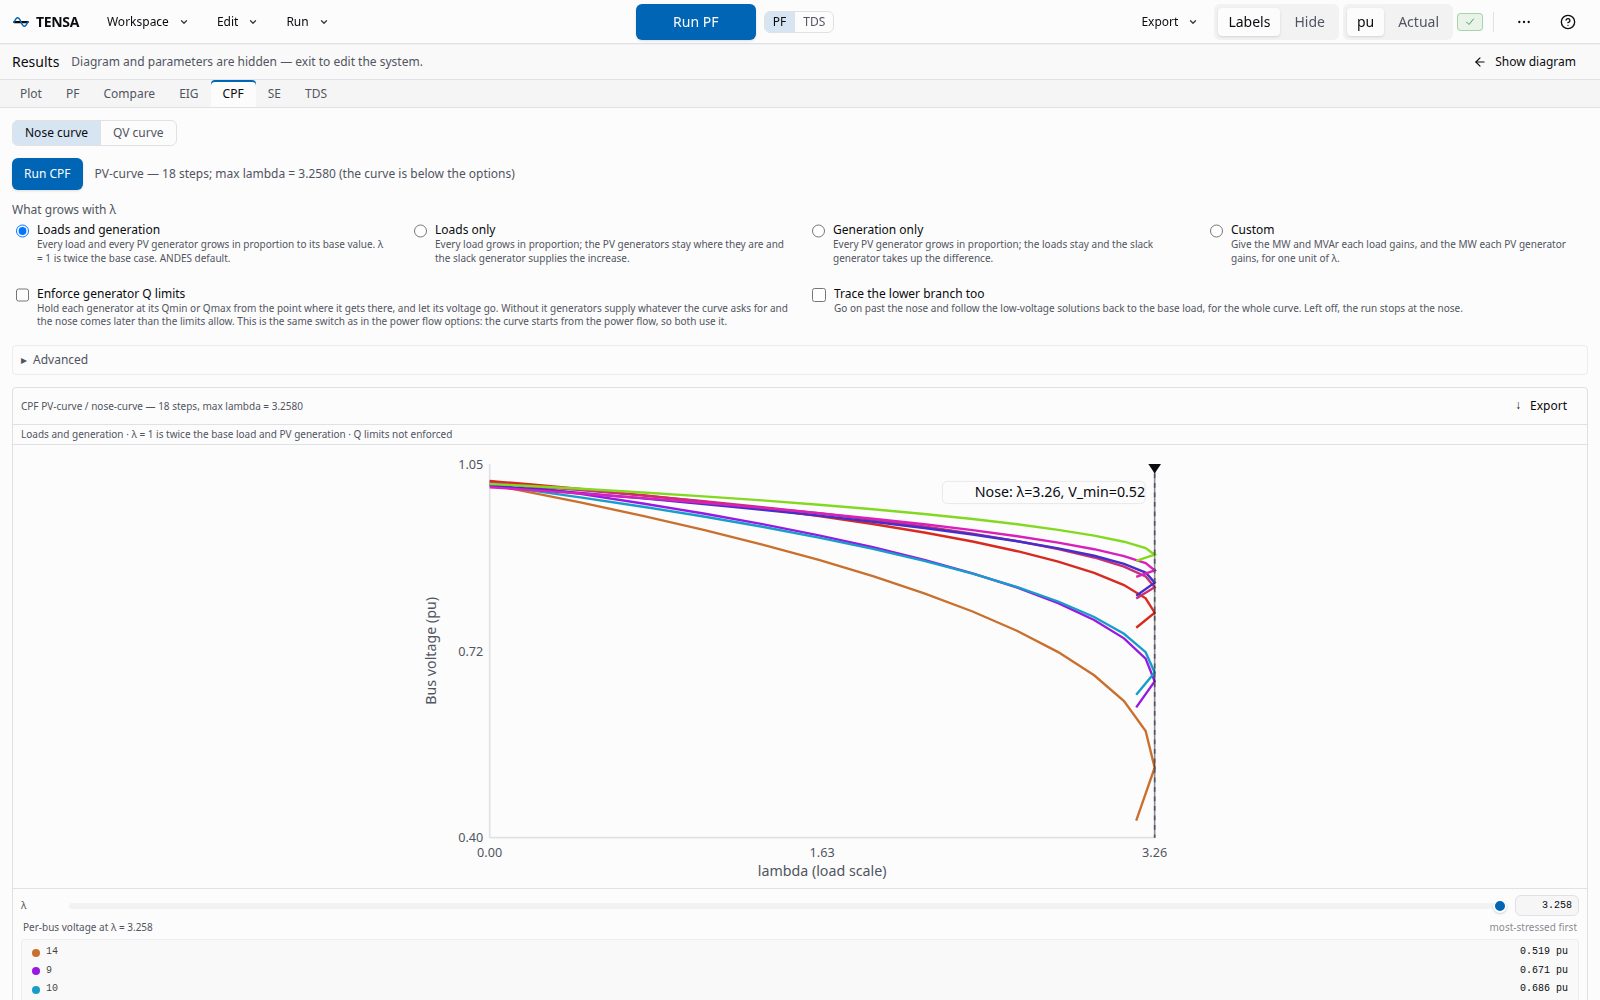
CPF traces the nose curve of the bus voltages as the load grows, in the direction you choose, with or without the generators' reactive limits, and a QV curve for one bus. The loading margin and the nose are marked on the curve. With the limits ticked after a power flow that left generators past a limit, a note names them as the table under the curve does (PV 2 (bus 2)), and its button runs the power flow with the limits and then the curve in one press.
SE has two steps: Generate measurements builds a measurement set from the converged power flow, and Run SE estimates the state from it and plots the residuals.
A parameter sweep is started from Run and is shown with its progress.
Saving and exporting
- Save system as writes a copy of the case, with the edits you made, to a file in the workspace, under a name it proposes from the open case (
wscc9-copy); Enter in the name saves. You go on editing the case you had open, not the copy: the notice of the save and the Project tab both say so, and each has a button that opens the copy. An.xlsxor a.jsonfile holds the whole case. A.rawfile holds the power-flow data only, as the format does: the machines, the controllers and the other dynamic models are left out of it. The diagram's layout is written beside the file, whichever format it is. A.rawfile numbers its generators, loads and lines afresh when it is read, and the layout finds them again by the buses they are on. - A snapshot stores the operating point, the disturbances and the diagram's layout, so that you can restore them later. If you have rearranged the diagram since the snapshot was saved, the restore says so and Keep my layout brings your arrangement back.
- A bundle is a
.zipwith the case file, the disturbances, the simulation settings, the results as CSV and the diagram's layout, which reproduces a study on another machine. Import bundle in the Workspace menu reads one back. - The HTML report is one self-contained file with the power flow tables, the limits it breaks, the comparison of two power flows, a chart of each plotted quantity, the eigenvalues and ANDES's own reports. It opens in any browser and prints.
- A time-domain run exports as COMTRADE (IEEE C37.111): a
.cfgand an ASCII.datin one.zip.
Finished runs and the kept power flows are stored in the browser, so a reload does not lose them. They are back in the run history and in the Compare tab the next time the page opens. The case itself is opened again by a reload, with the edits made to it (see Left rail).
Keyboard shortcuts
Press ? for the full list, which also has the mouse and keyboard gestures for moving a line of the diagram by hand and for connecting by a drag. The ones used most are:
| Keys | Does |
|---|---|
Ctrl+K |
Open the command palette |
Ctrl+O, Ctrl+S |
Open a case, save |
Ctrl+Z, Ctrl+Y |
Undo, redo an edit, or a move or a tidy of the diagram |
Ctrl+B, Ctrl+J, Ctrl+\ |
Toggle the left rail, the bottom drawer, the inspector |
Ctrl+Shift+M |
Toggle the results view |
Ctrl+/ |
Search the diagram |
Delete, Backspace |
Delete the draft that has the focus on the diagram |
Esc |
Abort a running time-domain simulation |
r then p, t, e, c, s, w |
Run the routine: PF, TDS, EIG, CPF, SE; w opens the sweep dialog |
Ctrl+Enter |
Run again: the routine that was run last |
g then h, s |
Open the run history, save a snapshot |
On a Mac, Cmd replaces Ctrl.